Wavelets in Plain English
Wavelets let you zoom in and out of a signal the way a camera swaps lenses: one view to capture the big scene, another to study details without losing the wider story.
Learn more: Signal Analytics • VectorWave • IronWave
Wavelets in One Paragraph
A wavelet is a short, wiggly waveform that you slide across a signal at different scales. At each position and scale, you ask, "How much does the signal look like this wavelet right here?" The answers become coefficients that describe both when and what frequency content occurs. Unlike the Fourier transform, which assumes infinite-length sine waves, wavelets keep time-local detail intact.
Why Not Just Fourier?
- Fourier tells you what frequencies exist but not when they appear.
- Real-world data (finance, speech, seismic) is often non-stationary—its patterns evolve.
- Wavelets handle edges gracefully and keep sharp features sharp, so you avoid smearing events across time.
How It Works (Zero Jargon Version)
- Pick a wavelet shape (the "mother" wavelet).
- Stretch or squeeze it to look for patterns at different scales.
- Slide it along the signal and record how strongly it matches at each point.
- The collection of matches is your time-scale map: large scales show trends; small scales show blips and spikes.
- You can reverse the process to reconstruct the original signal or only the parts you care about.
Core Vocabulary Cheat Sheet
- Scale: How wide the wavelet is. Large scale = zoomed out trend; small scale = sharp detail.
- Translation: Where the wavelet sits in time.
- Coefficients: The match scores; big coefficients mean strong similarity at that time and scale.
- Levels: Discrete scales used in a multilevel decomposition.
- Approximation vs. Detail: Trend versus texture at each level.
- Denoising: Shrink small, noisy coefficients and reconstruct a cleaner signal.
Common Wavelet Families
- Haar: The simplest wavelet—a step function. Great for learning and detecting abrupt changes.
- Daubechies (db4, db8, etc.): General-purpose workhorses with good time-frequency balance. The number indicates smoothness.
- Symlets (sym4, sym8, etc.): Near-symmetric cousins of Daubechies. Better phase properties, similar performance.
- Coiflets (coif2, coif4, etc.): Symmetric with vanishing moments in both the wavelet and scaling function. Good for signals where symmetry matters.
- Biorthogonal (bior3.3, bior4.4, etc.): Separate wavelets for decomposition and reconstruction. Allows exact symmetry while staying invertible.
- Morlet: A smooth, wave-like shape well-suited for continuous analysis.
When in doubt, start with Daubechies db4 for discrete transforms or Morlet for continuous transforms.
Common Transforms
- DWT (Discrete Wavelet Transform): Fast and compact. Splits your signal into levels, each half the size of the previous. Great when you need speed and don't mind losing some time alignment.
- MODWT / SWT (Maximal Overlap / Stationary WT): Same idea as DWT, but keeps full resolution at every level. Easier to interpret and align with your original signal.
- CWT (Continuous Wavelet Transform): Sweeps smoothly across all scales instead of jumping in steps. Produces detailed time-scale maps but costs more to compute.
- WPT (Wavelet Packet Transform): Splits both the trend and detail at each level, giving you a fuller tree of coefficients. Useful when interesting structure hides in the details.
- EMD (Empirical Mode Decomposition): Not technically a wavelet transform, but a related idea. Extracts oscillating modes directly from the data without choosing a wavelet shape upfront.
When in doubt, start with MODWT—it's the most forgiving for exploration.
Reading a Wavelet Plot
- Horizontal axis: time.
- Each colored line represents detail coefficients at a different scale.
- Jagged lines capture fine-scale activity (noise, sharp moves); smooth lines capture coarse-scale trends.
- Large swings in a line mean strong features at that scale; flat sections mean little is happening.
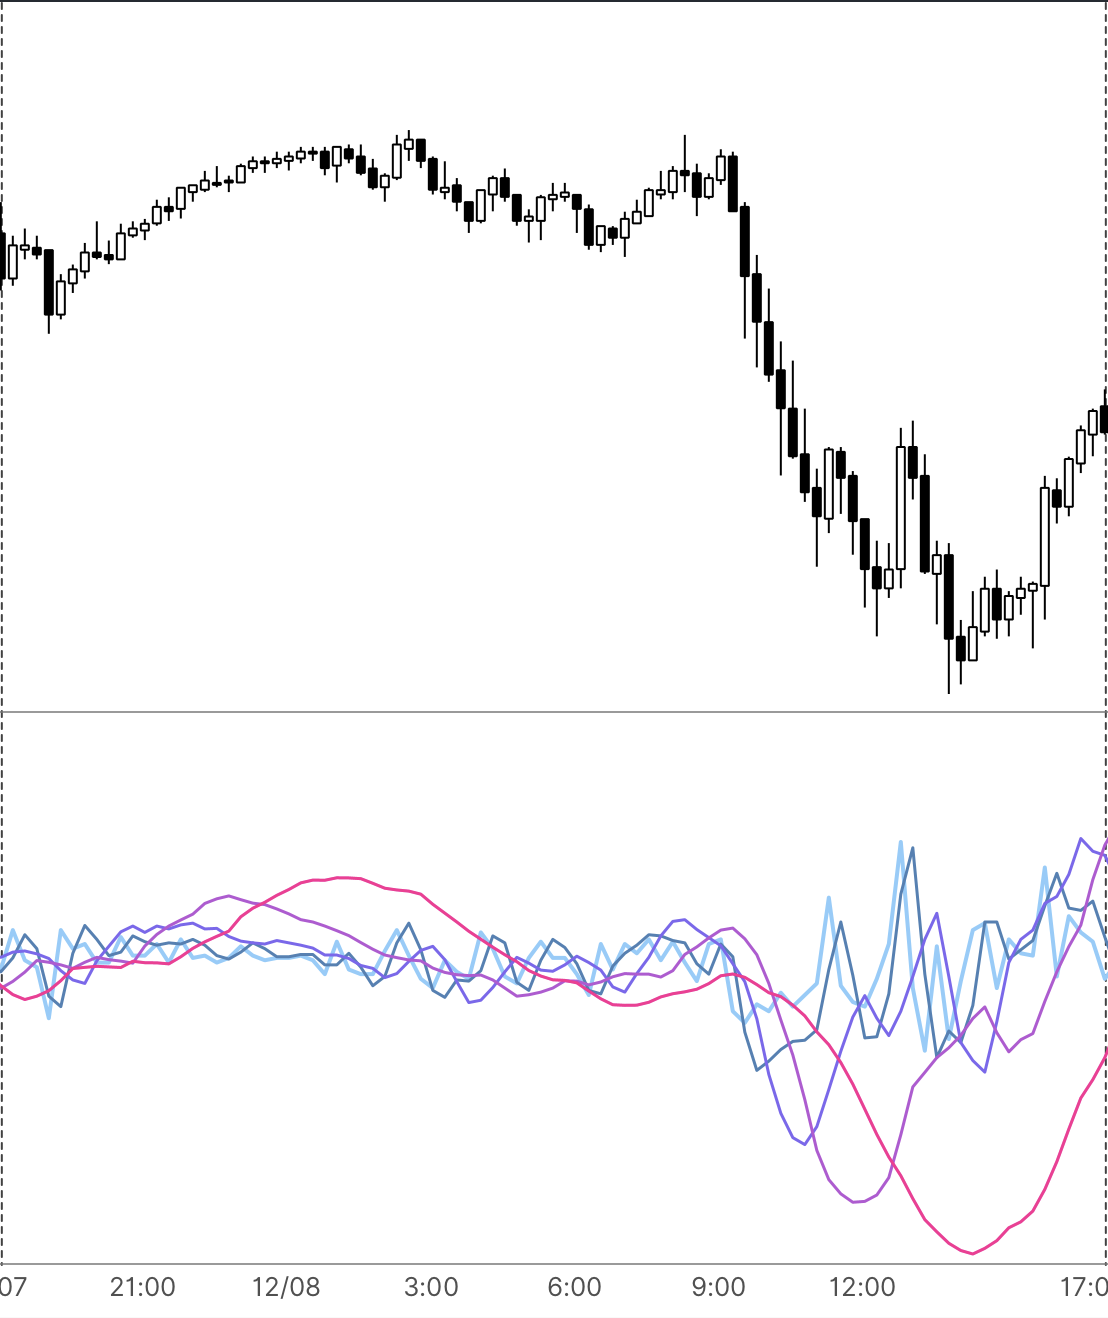 Wavelet detail coefficients at different scales. The jagged light-blue lines capture fine detail (noise, sharp moves), while the smooth pink line shows the underlying trend.
Three Quick Applications
- Denoising: Kill small coefficients, keep large ones, reconstruct. Noise drops; edges stay crisp.
- Anomaly detection: Spikes show as bright fine-scale patches. Track them to flag jumps or glitches.
- Trend/seasonality split: Use coarse scales for the slow drift and fine scales for cycles, then analyze each separately.
Using Our Libraries in Practice
- VectorWave (Java): Pass in your data, pick a wavelet, and get back detail coefficients you can plot or threshold. Works with arrays or real-time streams.
- IronWave (Rust): Same API, native performance. Pick whichever fits your stack.
- Workflow tip: Start with a small data sample, plot the coefficients to see which scales matter, then filter or denoise before feeding results into your models.
Minimal Mental Model to Remember
- Wavelets are localized templates you slide and scale.
- Coefficients tell you when and what scale something happens.
- You can throw away what you do not need (noise) and keep what matters (structure), then rebuild a cleaner signal.
Next Steps
Ready to dive deeper? Here's where to go next:
- Learn more: VectorWave (Java) or IronWave (Rust)
- Get started: VectorWave Quick Start or IronWave Quick Start
- Choose the right wavelet: Wavelet Selection Guide covers when to use which family
- Understand the math: Wavelet Properties explains vanishing moments, orthogonality, and filter design